[ Automated Clinical PQI Reporting ]
The Mission
To replace a manual reporting process with a reproducible Python-based Command Line Interface (CLI). The goal was to track performance metrics for clients across multiple providers with 100% accuracy and zero manual filtering.
The Problem Space
The existing workflow relied on Excel Pivot Tables, which struggled with:
- Fuzzy Text Matching: EHR data entries like “Diagnostic Evaluation” vs “Telehealth Diagnostic Evaluation” required manual grouping.
- Complex Logic: Calculating “Monthly Consistency” (ensuring a client was scored in every month they were seen) is difficult to scale in a standard spreadsheet.
- Data Integrity: Accidental whitespace or “text-formatted numbers” in scoring columns caused silent math errors.
System Architecture
The tool was built using a Zero-Footprint approach, utilizing a Python Virtual Environment (venv) to ensure portability across different workstations or a future deployment.
Key Feature: The “Logical OR” Check
To handle a clinical setup where assessments might be recorded in different columns, I implemented a vectorized “OR” gate. This ensures that as long as one valid clinical metric exists, the visit is counted as compliant.
# Convert scores to numeric, stripping whitespace, and apply OR logic
score_n = pd.to_numeric(df['Score_N'].astype(str).str.strip(), errors='coerce')
score_o = pd.to_numeric(df['Score_O'].astype(str).str.strip(), errors='coerce')

# A visit is 'Scored' if EITHER column contains a valid number
df['Is_Scored'] = score_n.notna() | score_o.notna()
Key Feature: Fuzzy Type Detection
Instead of strict string matching, the tool uses regex-style containment to catch all variations of a visit type, ensuring no data is left behind.
# Catching all variations of "Diagnostic Evaluation" or "Discharge Summary"
diag_mask = data['Type'].str.contains("Diagnostic Evaluation", case=False, na=False)
disch_mask = data['Type'].str.contains("Diagnostic Summary", case=False, na=False)
Documentation & UX
To ensure future use without a headache, the tool includes a CLI interface and a clear README.txt.
From the README.txt:
Standard Command:
python run_analysis.py "path/to/data.xlsx"

Metric Definition - Monthly Consistency %:
Checks every client's visit history. If a client was seen in 3 separate
months, they must have at least one scored visit in ALL 3 months.
Results
Processing Time: Reduced from ~45 minutes of manual pivoting to < 2 seconds of execution.
>> VISUAL_MANIFEST
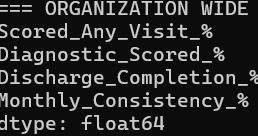
Analysis Output